


An AGV battery performance review should establish why an automated guided vehicle (AGV) can no longer complete its assigned work. Shorter runtime, a shutdown during lifting, an unexpected change in state of charge (SOC) and a charging shortfall require different evidence. Replacing a pack before separating these problems can leave the original fault unresolved.
Start with comparable operating conditions, then connect the vehicle's symptoms to measured energy, voltage, current, temperature and event records. This is a diagnostic method for engineers and fleet maintenance teams, rather than a product test or fleet life study.
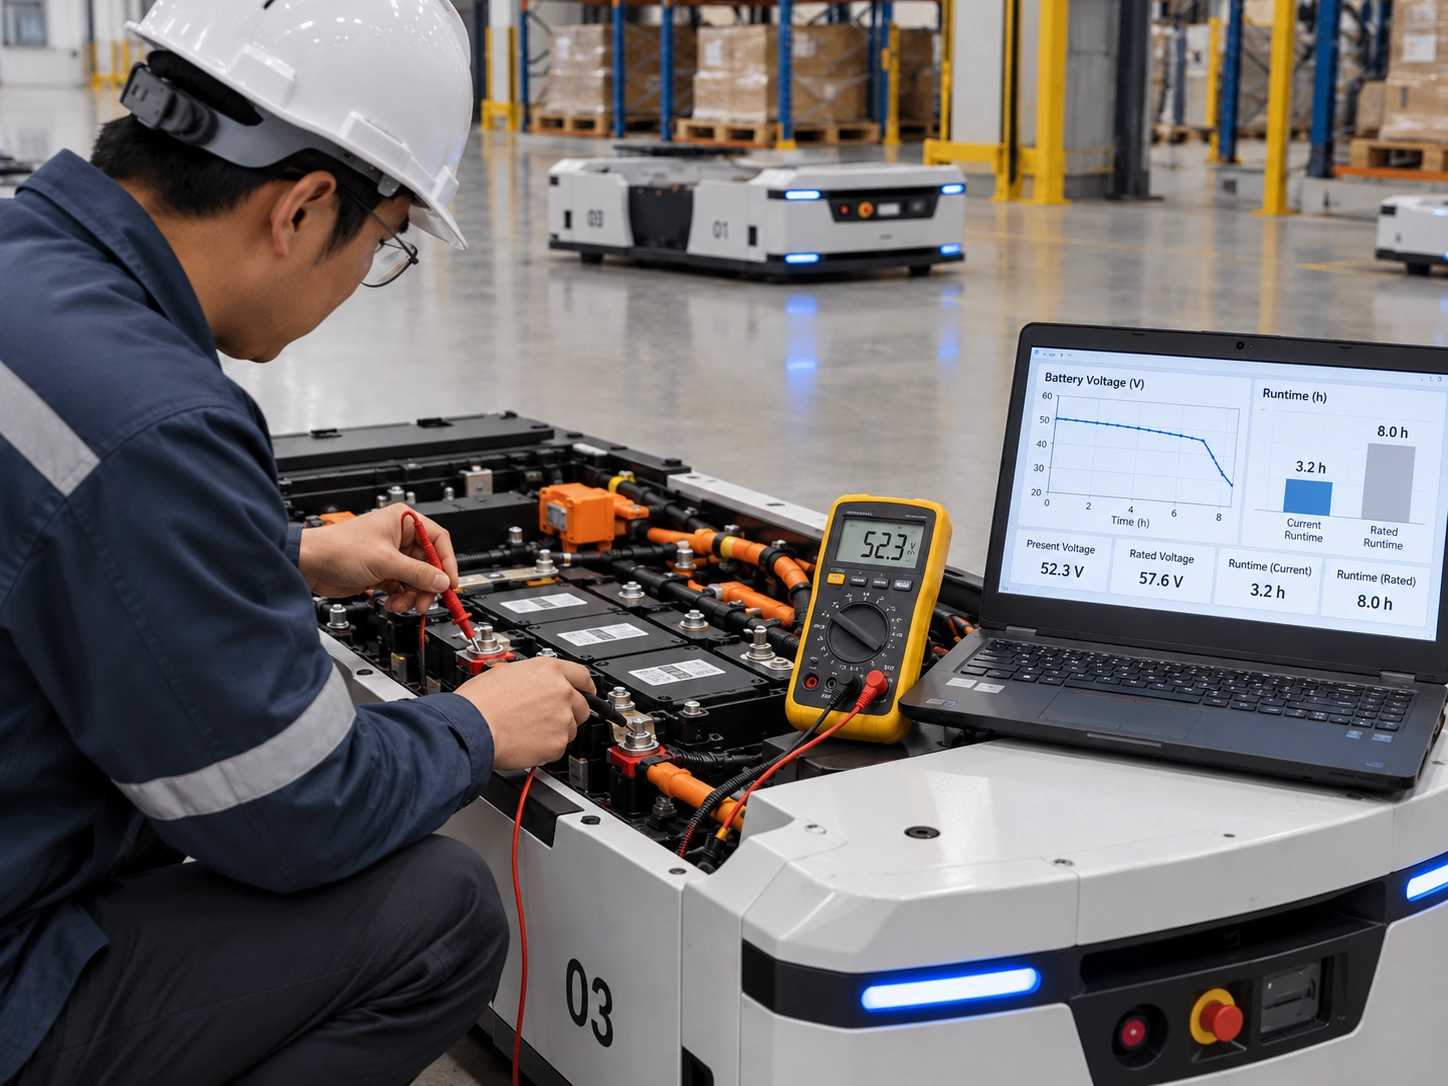
Define What "Poor Performance" Actually Means
Runtime, Power Delivery and Usable Capacity
Runtime measures how long the AGV operates between defined starting and stopping conditions. It changes with payload, route, waiting time, auxiliary loads and charging history. A shorter shift alone does not identify battery deterioration.
Usable capacity describes the charge delivered under a specified test procedure, commonly expressed in ampere-hours (Ah). Usable energy, expressed in watt-hours (Wh), also accounts for voltage throughout discharge. Power delivery describes whether the battery and electrical path can support the required load without unacceptable voltage drop or a protective interruption.
A pack can pass a moderate-current capacity test and still fail during a brief acceleration demand. Conversely, a vehicle can lose runtime because each mission consumes more energy even when measured capacity remains comparable. Define the endpoint: a vehicle-requested return to charge, a controller undervoltage event and a battery management system (BMS) disconnection are different outcomes.
| Observed symptom | Evidence to obtain first | Conclusion the symptom does not establish |
|---|---|---|
| Shutdown during acceleration or lifting | Synchronized current, pack-terminal voltage, controller-input voltage and fault events | The pack has exhausted its capacity |
| Shorter runtime on apparently similar work | Comparable mission records, charge starting conditions and measured discharge energy | The rated cycle life has been reached |
| SOC jumps or disagrees with dispatch expectations | Raw BMS messages, decoded values, timestamps and a defined reference test | A cell has suddenly failed |
| Frequent docking but declining end-of-shift charge | Actual battery-side charge and discharge energy, plus effective charging time | More ampere-hours will solve the problem |
| Rising or uneven temperature | Sensor positions, ambient conditions, current history and local temperature measurements | Every cell is deteriorating at the same rate |
Refer to the project's agreed interface and acceptance documents to identify the operating limits established before commissioning. The AGV battery interface and acceptance requirements discussion can help identify missing fields, but it does not replace the documents for the installed configuration.
Build a Comparable Operating Baseline
Record the Task, Temperature and Charge Starting Point
Compare repeatable work before comparing battery age. A route with more loaded starts, longer queues or increased auxiliary demand is a different duty cycle, even if the vehicle travels the same distance.
Create one operating record for each comparison run:
| Record group | Fields to retain | Why it matters |
|---|---|---|
| Hardware and software | Vehicle ID, pack model and serial number, charger model, controller and BMS firmware | Configuration changes can alter limits or reported values |
| Mission | Payload, route, gradients, starts, lift operations, completed missions and idle time | Separates task demand from battery performance |
| Starting condition | Charging completion criterion, reported SOC, temperature, rest interval and recent charging history | Equal displayed SOC does not guarantee equal starting energy |
| Electrical measurement | Sensor location, current polarity, calibration status, sample interval and clock alignment | Makes energy and event comparisons interpretable |
| Endpoint | Elapsed time, delivered Wh and Ah, minimum voltage, alarms and actual stopping reason | Distinguishes depleted energy from an interrupted discharge |
For a repeated mission, calculate battery-side Wh per completed mission alongside total runtime. If Wh per mission rises while controlled discharge energy remains similar, investigate task demand, vehicle losses and route changes. If discharge energy falls under a comparable test, investigate the pack and the conditions limiting its usable energy.
These indicators narrow the investigation; they do not assign a component failure by themselves. A firmware change, for example, could affect both the vehicle's consumption and its stopping criterion. Change one suspected factor at a time where practical, and record unavoidable differences.
Separate Capacity Loss from Load-Triggered Shutdowns
Capture the Event Before Replacing the Pack
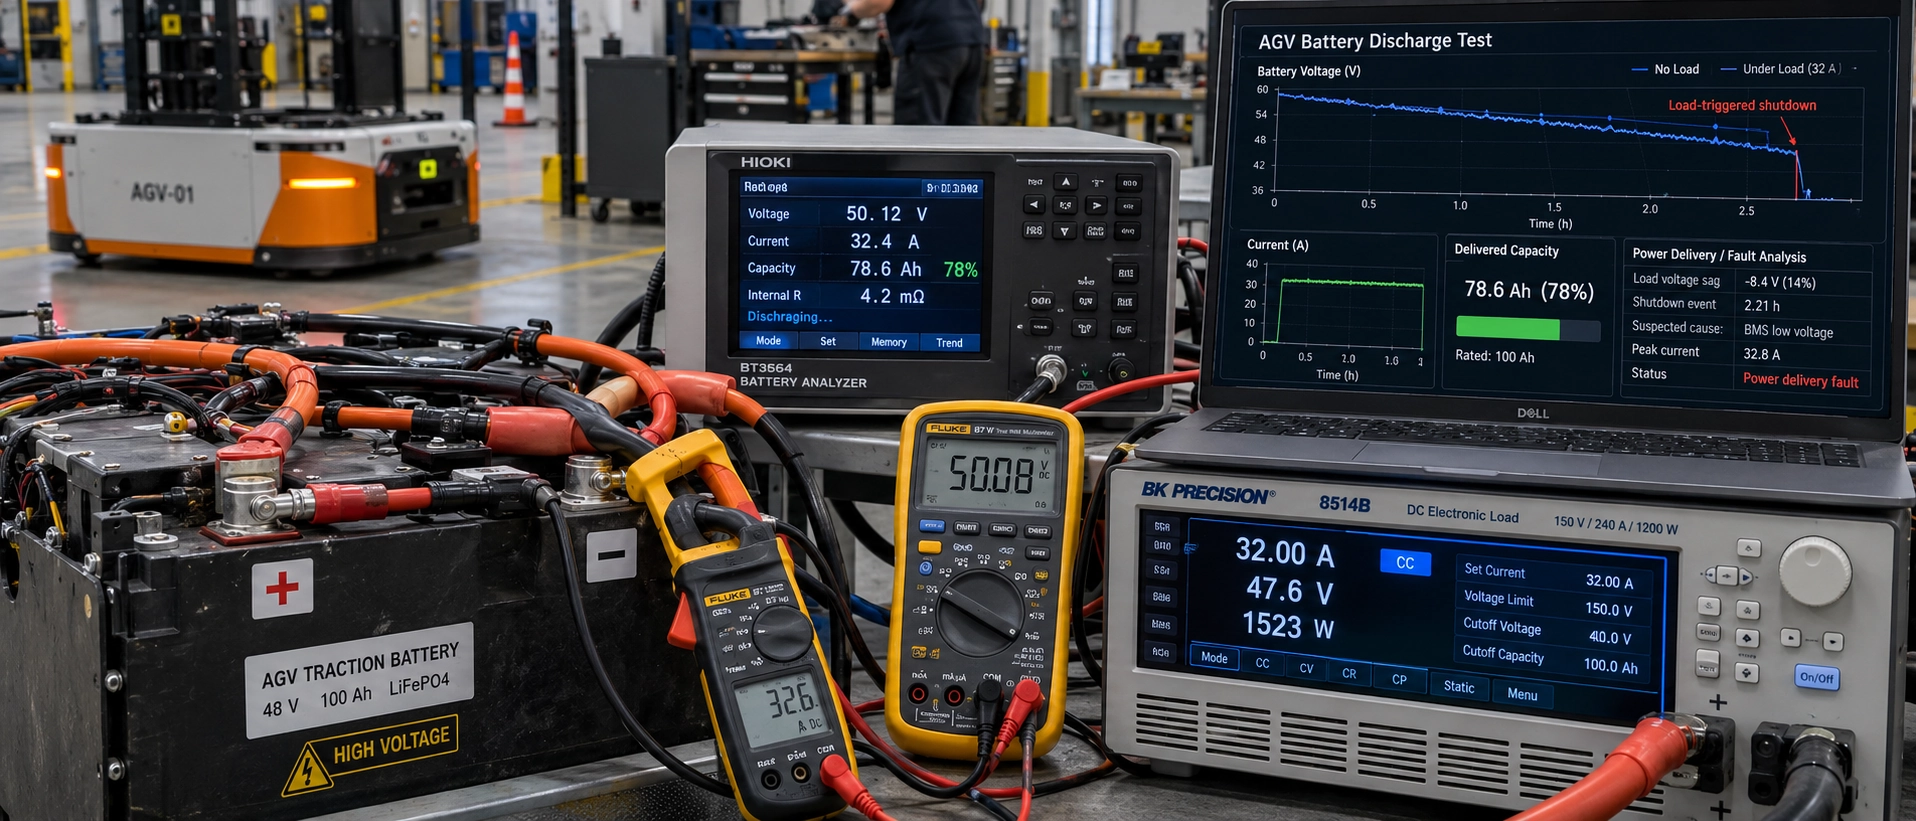
A shutdown during a current peak calls for an event trace. A slow trend log may show normal values immediately before and after the event while missing the transient that caused it. Select measurement bandwidth and time resolution for the event being investigated, and document sensor filtering and message update delays.
Record pack-terminal voltage, controller-input voltage and current on a common timeline. Add minimum cell voltage and cell identity where available, BMS protection flags, discharge permission, contactor state and the vehicle's fault code. Preserve data before the shutdown as well as after it; the final fault message may describe a consequence rather than the first abnormal condition.
Use the trace to separate three diagnostic branches:
- Pack voltage falls with the load. Review minimum cell behavior, temperature, starting charge and permitted peak current duration. A weak cell, low starting charge or a temperature-related limitation may produce similar symptoms. Pack voltage alone cannot distinguish them.
- Pack voltage remains acceptable while controller-input voltage falls. Investigate the intervening power path, including connectors, cables, fuses and contactors. Confirm measurement points and clock alignment before attributing the difference to resistance.
- A permission or communication event precedes the stop. Check whether the BMS withdrew discharge permission, a contactor opened, or the vehicle acted on a stale message or timeout. Compare the sequence against the agreed interface specification.
During a reasonably steady discharge interval, the difference between pack-terminal and controller-input voltage can help assess the external path. Dividing that difference by current gives an apparent path resistance between those measurement points. Switching transients, sensor offsets and timing errors can invalidate the estimate; it is not an isolated measurement of cell resistance.
A controlled capacity test answers a separate question: how much charge and energy the pack delivers under its approved test conditions. Keep discharge current, temperature, charge preparation and cutoff criteria consistent. Ending one test at the controller's limit and another at the BMS limit does not produce a comparable capacity trend.
Arrange energized measurements and load reproduction through qualified personnel using approved equipment and procedures. Do not bypass protection or repeatedly provoke a protective trip to finish a test.
Check Whether SOC Still Predicts Task Capability
Review Estimation and Message Interpretation
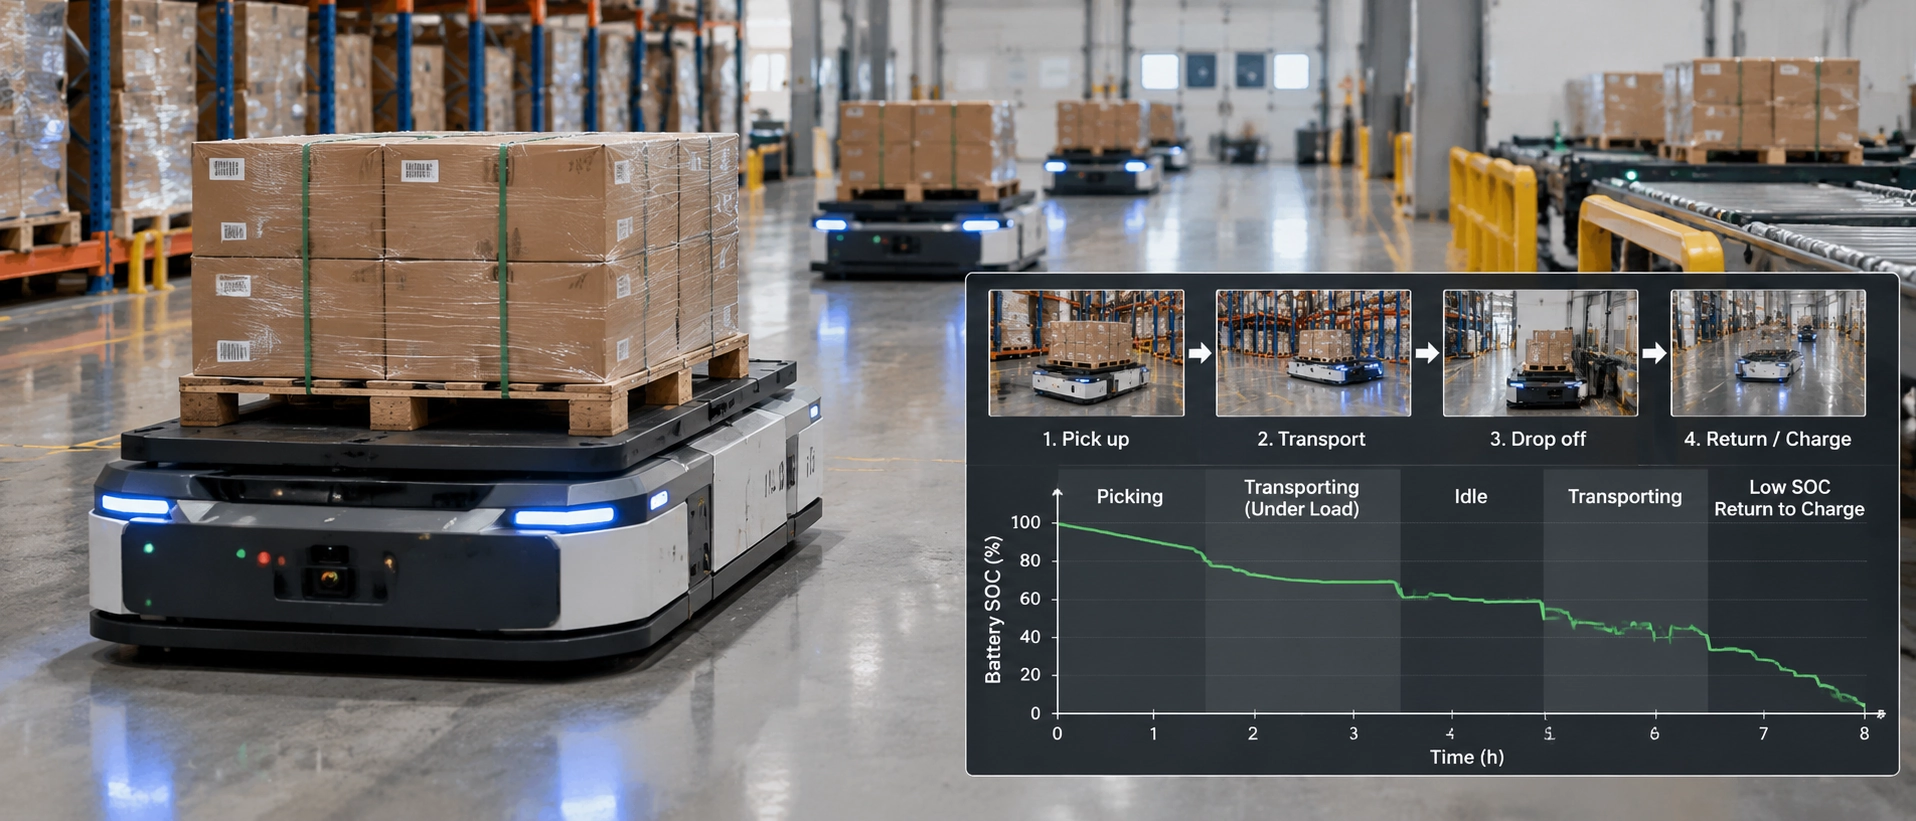
SOC is an estimate of remaining charge. Its usefulness for dispatch depends on both the BMS estimate and the vehicle's interpretation of that estimate.
Lithium iron phosphate (LFP) cells have a flat voltage profile and voltage hysteresis, which complicate voltage-based SOC estimation. Analog Devices' 2019 technical article on LFP fuel gauging explains these challenges and the importance of configuring the gauge for the particular cell. Its algorithm test does not establish the accuracy of an AGV pack's BMS.
First compare the raw message with the value displayed by the vehicle and consumed by the fleet manager. Verify message identifier or register address, scaling, units, byte order, sign convention, validity flags and update timing. A Controller Area Network (CAN) or RS-485 interface alone does not define how the receiving software should interpret each field.
If decoded values agree, evaluate estimation against an approved reference procedure. Use a defined starting condition and calibrated current integration, with temperature, reference capacity and endpoint documented. Two SOC displays are not independent references if both originate from the same BMS value.
During frequent opportunity charging, review whether the actual duty cycle supplies the conditions required by that BMS's learning or correction method. Do not impose a generic full-discharge or full-charge calibration routine without supplier approval.
Finally, test what dispatch actually needs. An SOC estimate can be reasonably consistent while a heavy mission remains infeasible because peak power is restricted or the reserve needed to reach a charger is insufficient. Validate mission completion and return-to-charge capability alongside SOC behavior.
Audit the Energy Recovered Between Missions
Compare Charge Ratings with Delivered Energy
A charger rating describes capability under specified conditions. Energy recovered during a dock depends on successful contact, startup time, BMS permission, current limits, temperature, charging control and time connected. If the vehicle remains powered, some charger output may also serve onboard loads.
Choose the measurement boundary before calculating energy:
| Measurement boundary | What the reading represents | How to use it |
|---|---|---|
| Charger output | Total electrical output delivered by the charger | Do not assume all of it enters the battery when vehicle loads share the supply |
| Battery branch at the pack terminals | Net electrical energy entering or leaving the pack | Use voltage at this boundary and current through the battery branch |
| Auxiliary-load branch | Energy used by the loads measured on that branch | Use it to explain demand; do not subtract it again if battery current already reflects the split |
For voltage in volts, current in amperes and time intervals in seconds:
Energy in Wh = Σ(V × I × Δt) ÷ 3,600.
Define the current sign, then accumulate charging and discharging separately. Include all energy crossing the selected battery boundary, including regenerative charging where the vehicle provides it. Dock records alone are incomplete if another source also returns energy to the pack.
Battery-terminal charge energy measures electrical input, rather than the exact increase in recoverable stored energy. Internal losses remain. Likewise, charger-output Wh and battery-input Wh cannot be treated as interchangeable measurements.
For each dock, retain scheduled dwell, actual connection time, time at charging current, battery-side Wh and the reason charging ended. Across a shift, compare all measured inputs and outputs over the same interval. Use consistent starting and ending conditions when evaluating whether the schedule replenishes the battery.
Illustrative energy balance, not fleet test data: assume eight docks each provide 200 Wh of measured battery-terminal input, with no regenerative charging or other input during the shift. Total input is 1,600 Wh. If measured battery discharge output is 1,900 Wh, input is already 300 Wh below output before accounting for internal losses.
Repeating that schedule will draw down stored energy. A larger pack may postpone the operational symptom, but it does not correct the recurring charging deficit.
Review dock access, queueing and charging strategy for automated warehouse fleets before changing pack capacity.
Check Charger and BMS Cooperation
When a vehicle docks but recovers too little energy, compare the approved charging specification with the actual sequence. A matching voltage label is insufficient.
| Check | Compare against the approved configuration | Evidence to retain |
|---|---|---|
| Output voltage | Charger regulation and termination settings versus the pack's permitted charging limits | Charger settings, pack specification and measured voltage |
| Charge current | Charger capability, configured limit and the BMS's permitted current under the observed conditions | Requested, permitted and measured current where available |
| Charging profile | The required control stages, including constant-current/constant-voltage (CC/CV) operation where specified | Approved profile and recorded voltage/current curve |
| Charge permission | Enable signals, permission withdrawal and the corresponding response | Timestamped charger and BMS states |
| Temperature restrictions | Charge inhibition, derating and any approved heating sequence | Relevant sensor temperatures and limit states |
| Communication and fault handling | Message definitions, validity checks, timeouts and specified responses | Protocol revision, messages and fault records |
| Charge termination | The specified completion criterion, current taper and reason for stopping | End-of-charge events and final measurements |
Use the records to distinguish a command from a result. If charging is permitted but measured battery current remains low, inspect charger output, vehicle demand and the intervening power path. If permission is withdrawn first, identify the recorded condition behind that decision before treating the charger as faulty.
Do not raise voltage, current or temperature limits to make a charging window fit. Resolve the mismatch against the approved battery, charger and vehicle requirements.
Check a Charging Claim Against Its Assumptions
Polinovel's 48 V platform and LEV4850 specification table illustrate why a product platform name and a model's nominal voltage should be read separately: the product is described as 48 V, while its table lists 51.2 V nominal voltage. Neither label establishes the complete operating voltage window or charger compatibility.
A charge-time calculation also needs an explicit capacity, net battery current and charge window.
Illustrative calculation, not a verified LEV4850 charging result: assume a pack has a nominal voltage of 51.2 V and capacity of 50 Ah, and that its approved configuration permits a constant net battery charge current of 50 A throughout the interval being considered.
- Nominal energy is 51.2 V × 50 Ah = 2,560 Wh. This is not a measurement of usable energy.
- Adding charge equal to 80% of nominal capacity means adding 40 Ah.
- At a constant net battery charge current of 50 A, the ideal charge-transfer time is 40 Ah ÷ 50 A = 0.8 hours, or 48 minutes.
The calculation assumes no taper, interruptions or charge inefficiency. Because 50 A is defined as net battery current, any concurrently powered vehicle loads must already be accounted for in establishing that current.
The result is not a measured 0–80% SOC charging time. Displayed SOC need not map exactly to nominal ampere-hours. Applying the method to an installed pack requires its current controlled specification, charger capability and measured charging profile. A shorter-time claim cannot be transferred to this example without changing and verifying its assumptions.
Review Temperature and Aging Under the Same Conditions
Distinguish Temporary Performance Changes from Persistent Loss
A performance difference observed at different temperatures does not, by itself, establish permanent deterioration. Compare the pack under approved reference conditions before treating the difference as an aging trend. For the installed configuration, request temperature-dependent discharge data and the BMS's charge and discharge restrictions.
Long-term aging evidence answers a different question. Naumann, Spingler and Jossen's 2020 study examines capacity and impedance evolution in a specific commercial LFP/graphite cell under varied temperature, current, depth-of-discharge and SOC conditions. The TUM institutional abstract supports considering those operating conditions when interpreting aging. The abstract also reports pronounced, partly reversible capacity loss during shallow cycling at medium SOC. That finding is specific to the tested cell and conditions; it does not establish a universal opportunity-charging rule. The study does not provide an AGV pack's immediate temperature-performance curve or a fleet life prediction.
For an AGV investigation, compare available temperature channels against current and time. Record sensor positions and establish whether they represent cells, electronics or the enclosure. An external thermal image can help locate an accessible connector hotspot, but cannot establish the internal temperature of every cell.
If shutdowns appear after repeated heavy missions, compare early-shift and later-shift traces at similar SOC and load. Check whether temperature-related current limits or protection states change before the failure. For cold operation, distinguish charging restrictions from discharge restrictions and repeat tests only within approved conditions.
Use the pack's documented limits rather than a universal temperature-spread threshold. Persistent local heating, a changing voltage response or declining controlled energy warrants supplier investigation, but none identifies a failed component without supporting evidence. The battery pack thermal and protection design discussion helps identify the configuration information needed for that review.
Retain calendar age, cumulative throughput, SOC window, temperature exposure and storage history. Charging connection count alone is an inadequate measure of life consumed: brief replenishment sessions do not each represent a full cycle, and elapsed time also matters.
Decide What to Investigate, Repair or Replace
The replacement decision should follow repeatable evidence and the vehicle's agreed mission requirements. Neither a cycle counter nor a single state-of-health (SOH) value establishes whether the pack can safely complete its work.
| Evidence pattern | Next action | What would support replacement assessment |
|---|---|---|
| Controller voltage falls while pack-terminal voltage remains acceptable | Inspect and verify the external power path | Independent evidence that the pack also fails its requirements |
| Controlled capacity is comparable, but load-related trips recur | Review peak demand, cell response, permitted duration and protection behavior | Confirmed inability to meet the approved mission profile after external causes are addressed |
| Raw BMS data and vehicle display disagree | Correct message interpretation or software handling | Separate evidence of pack deterioration; a display fault alone is insufficient |
| Dock energy is repeatedly inadequate | Resolve missed charging, current limits, connection problems or schedule constraints | A demonstrated capacity or power requirement that the existing configuration cannot meet |
| Comparable tests show persistent energy loss | Review test uncertainty, endpoints, cell behavior and agreed service criteria | Repeatable loss that prevents the required mission or crosses a contractual service limit |
| Damage or abnormal heating creates a safety concern | Remove the vehicle or pack from service under site procedures and seek qualified assessment | Findings from the approved safety and service process |
Where a pack remains within its approved operating conditions but no longer meets required runtime, replacement may be appropriate even without a protective trip. Where the fleet's task has changed, the decision may instead be a configuration change. Record that distinction so an application mismatch is not reported as unexplained battery failure.
Keep safety documentation separate from performance acceptance. IEC 62619:2022 concerns industrial lithium cell and battery safety, with AGV motive applications included in its public scope. It does not establish a particular vehicle's runtime or lifetime.
ISO 3691-4:2023 addresses driverless industrial truck and system safety; its published scope excludes power-source requirements. As checked on 30 October 2026, ISO lists the 2023 edition as published and due for revision, with ISO/DIS 3691-4 under development. Confirm the edition applicable to the project rather than treating the draft as a published replacement.
Prepare an Evidence Pack for Your Battery Supplier
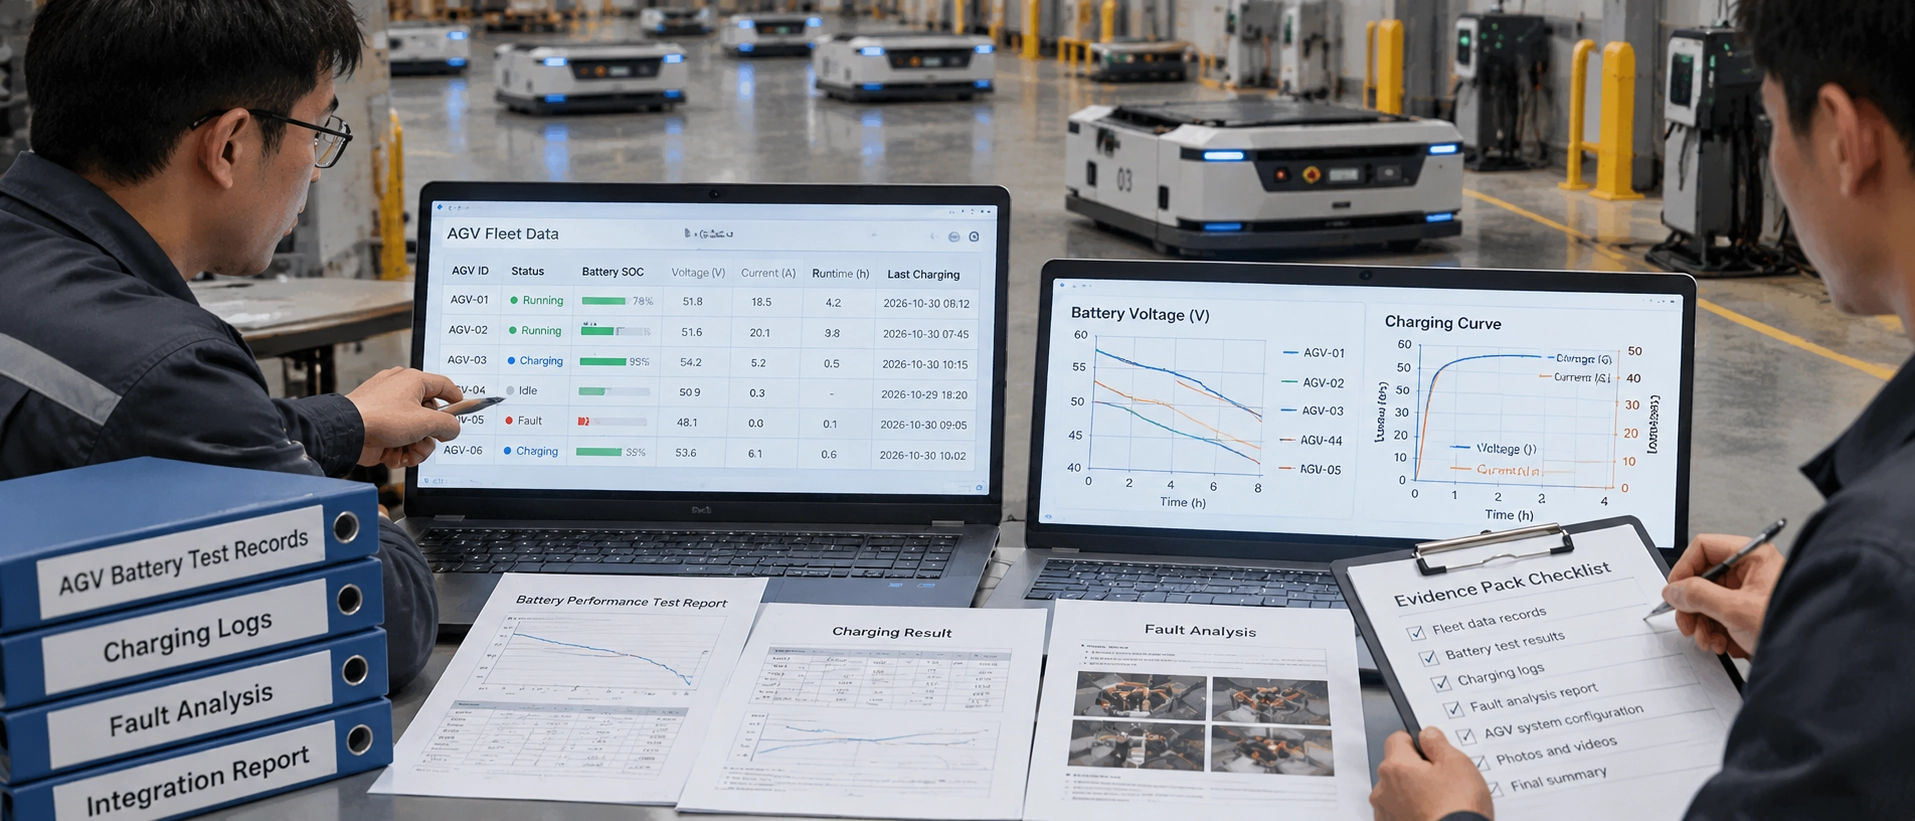
Send a reproducible problem statement rather than only "short battery life." Include:
- Configuration: vehicle and battery identifiers, controlled specifications, charger model, firmware versions and relevant settings.
- Mission conditions: payload, route, ambient and pack temperature, charging history, starting condition and exact stopping event.
- Synchronized records: current, pack-terminal and controller-input voltage, available cell and temperature data, SOC, protection flags and vehicle faults, including pre-event data.
- Measurement information: instruments, sensor locations, units, polarity, sampling and message intervals, clock alignment and calibration status.
- Charging and comparison results: effective dock time, battery-side input and output Wh, any regenerative input, comparable mission records, approved capacity-test procedure and controlled changes already evaluated.
- Interface documents: protocol revision, message definitions, validity and timeout handling, charging permissions, termination rules and contactor sequences where applicable.
Ask the supplier to identify which evidence supports its diagnosis, what remains untested and which controlled test would distinguish the remaining explanations. After a repair or configuration change, repeat the relevant mission and confirm that the original symptom is resolved under the same comparison conditions.
For a Polinovel application review, submit this evidence with the AGV model, required voltage window, capacity, continuous and peak current with duration, charging window, charger model and CAN or RS-485 requirements. Request an assessment of AGV battery configurations for your operating profile, identifying the proposed limits, remaining compatibility questions and validation needed before approval.


